Rakuten · Sr. Director of Product Design
Onboarding
Three onboarding experiments added $2.5M in revenue in 12 weeks. They unlocked funding for a full onboarding rebuild.
The brief
A vague brief
Onboarding is the revenue engine at Rakuten. It is the first moment where trust, clarity and value must land.
The requirements doc said: "Increase conversion with onboarding." It had no defined scope and no data sources. We had three months to launch new 0-to-1 options.
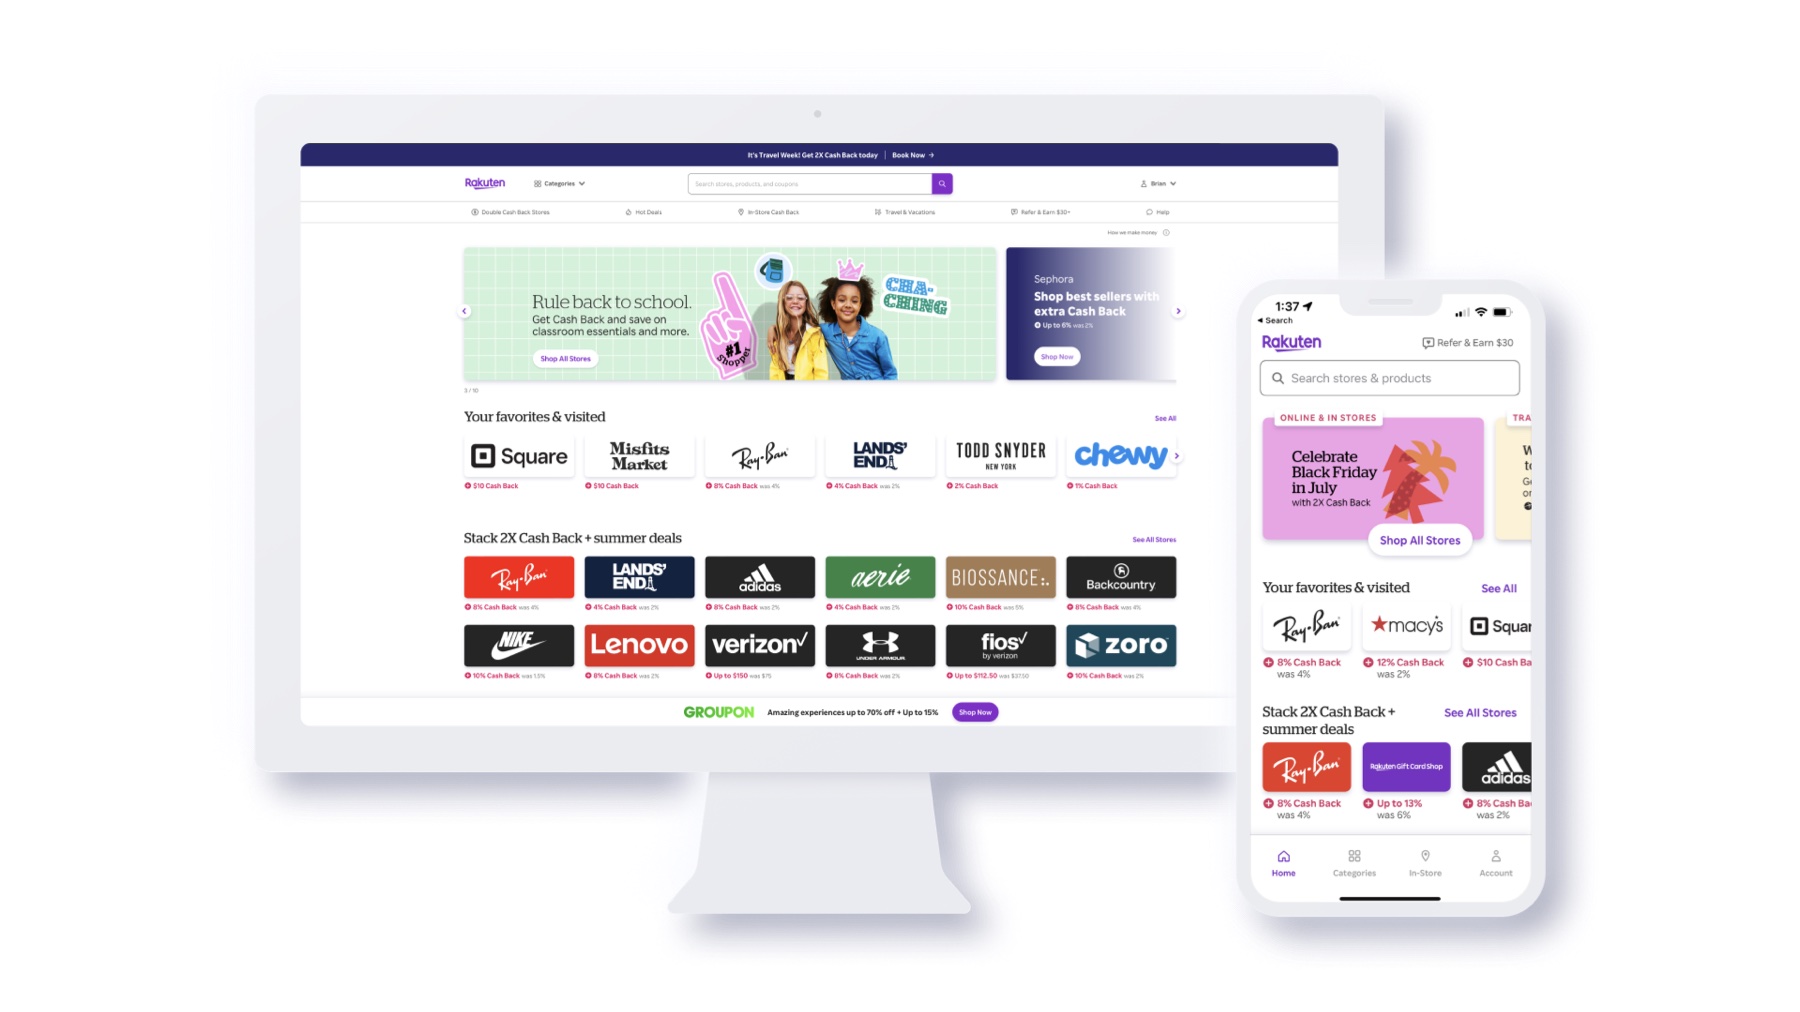
Onboarding was a forced sign-up before customers could see the product. It hooked them with a few brand logos and went no further.
I paused the team and reframed the work with the PM and designer. We wrote an opportunity evaluation doc, a pre-PRD. It aligns PM, design and engineering on the problem, constraints, hypotheses and success criteria.
Targets: raise visitor-to-paid conversion 3%, raise sign-up-to-shop and shop-to-first-purchase rates 3%, and cut call center rate 2%.
My role and team
Sr. Director of Product Design. I led two tribes and twelve squads: 12 designers, 2 copywriters, 1 researcher and a design system lead.
On this project I partnered with a product director, a principal designer, a PM, an engineering manager and a researcher. Four developers built it.
The problem
Onboarding leaked revenue at every step.
Most potential customers never make a first purchase. New customers ("Newbies") formed an impression in the first 10–15 seconds, before anything explained the product. Mobile web had the highest traffic and the lowest conversion.
The forced sign-up, recorded from the product, and the home feed that follows it.
Friction before trust
Customers had to sign up before they saw how Rakuten worked or how they would earn money. The logos they saw first did not match where they shop.
Choice became a burden
After sign-up, a wall of merchant logos appeared with no next step. Customers asked: "Do I need to pick a store?" "Is this an ad?" "What do I do now?"
No funnel analytics
Rakuten had no reliable funnel analytics after years on an old stack. I partnered with BI to rebuild the funnel.
The funnel
Rakuten lost revenue at the top of the funnel.
Bars at true scale.
The data pointed to behavior, not technology
- 20% of new members make a purchase.
- 39% of new members never return.
- 16% give a mailing address.
- 8% of first-time buyers receive their welcome bonus.
- 40% open the welcome email.
What it was worth
A 10% lift in Newbie-to-first-time-buyer rate over a year meant 275,000 more first-time buyers. That meant 2.3M more orders and $9.8M more in commission, based on the 2019 conversion rate of 22.1%.
Every 1% was worth $1,000,000. That turned experimentation into an executive priority.
What we learned
Customers did not understand how Rakuten worked.
The research
With a compressed timeline, I ran lightweight discovery: dogfooding, ForeSee and app review data, moderated interviews, and usertesting.com sessions. We looked for patterns, not volume.
Customers told us:
- "I don't get how Rakuten works."
- "I immediately feel overwhelmed."
- "2% really isn't worth the hassle."
- "This isn't personalized to me."
- "Rakuten is a scam, avoid this app."
Three findings
- Mental model gap. Customers did not understand what Rakuten is or how it works.
- Cognitive overload. Too many choices came too fast, with no direction.
- Motivation gap. The reward did not justify the effort, especially for customers already using a competitor like Honey.
What we tested
Three tests. Three drivers.
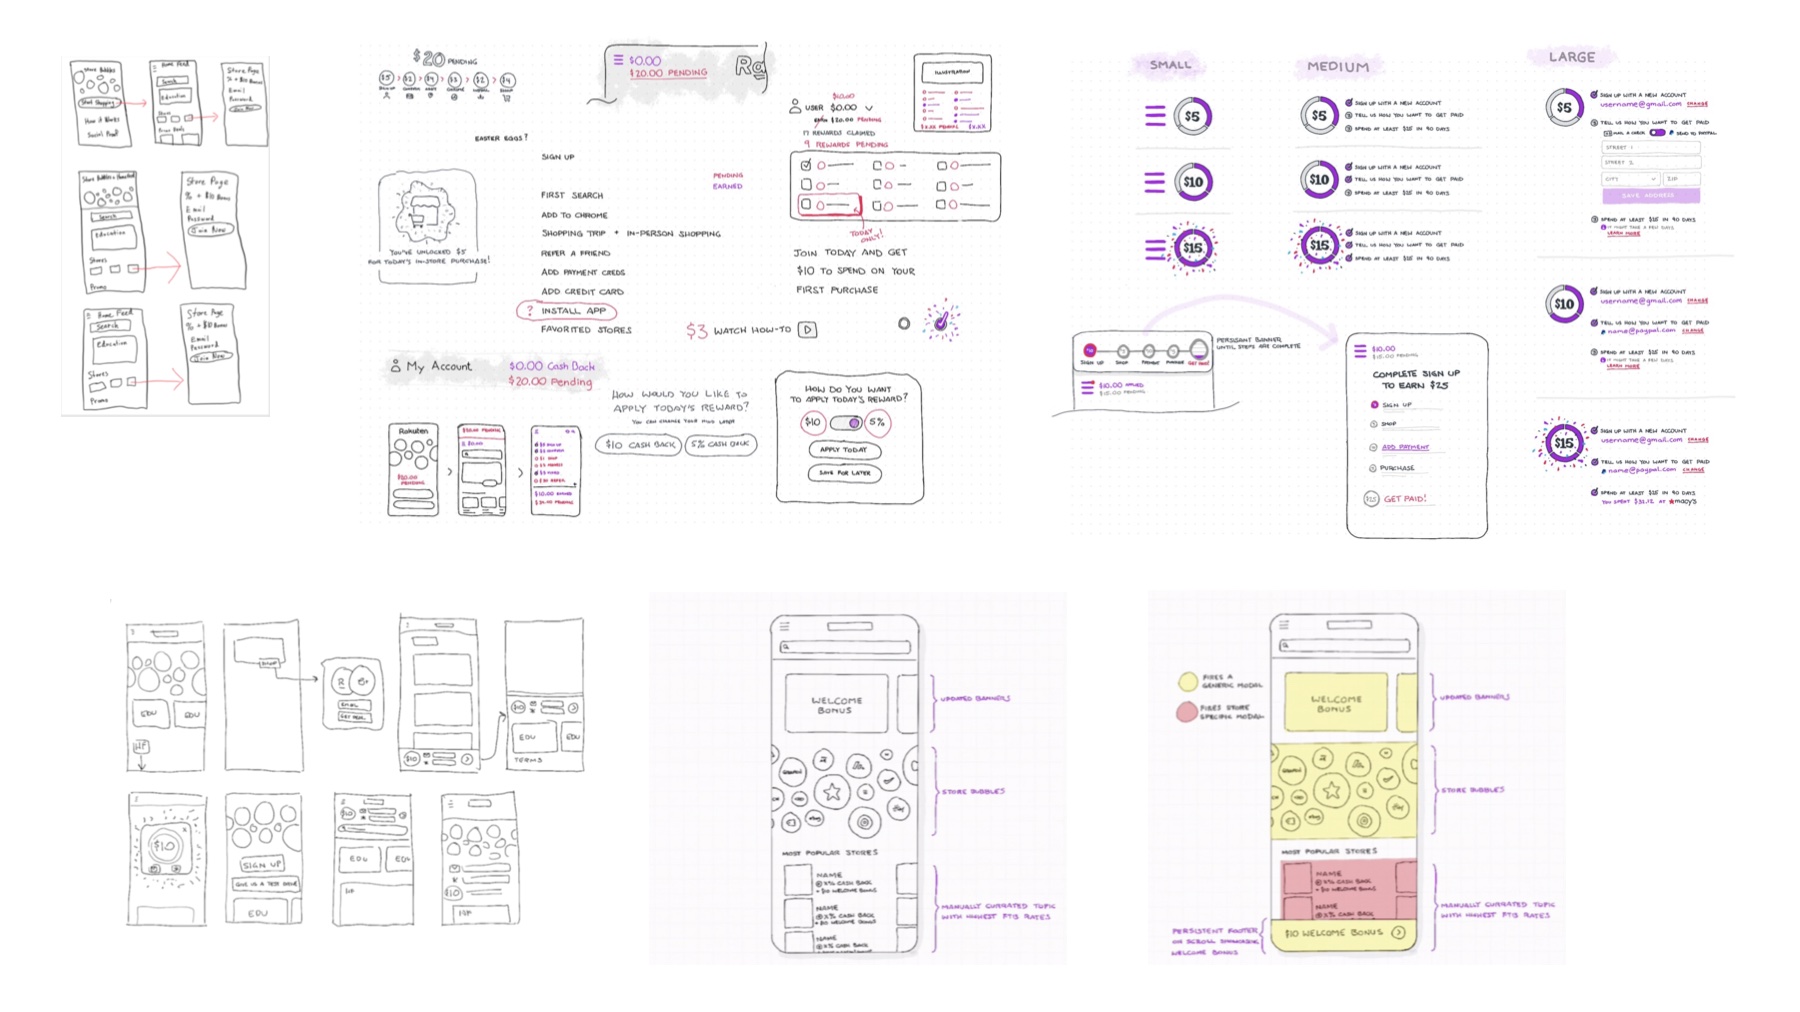
We opened with rapid sketching sessions with design, product and engineering. We mapped the opportunity space by impact and effort, and filtered to three concepts. Each tested one driver of conversion. Each was a low engineering lift, so each ran as a 4-week A/B test.
Perceived value · +1 point
Incentivized milestones. We split the welcome bonus into milestone rewards. They covered the three steps to a first paycheck: sign up, add a valid mailing address, make a qualifying purchase. Each step also taught how Rakuten works.
Trust · +3 points
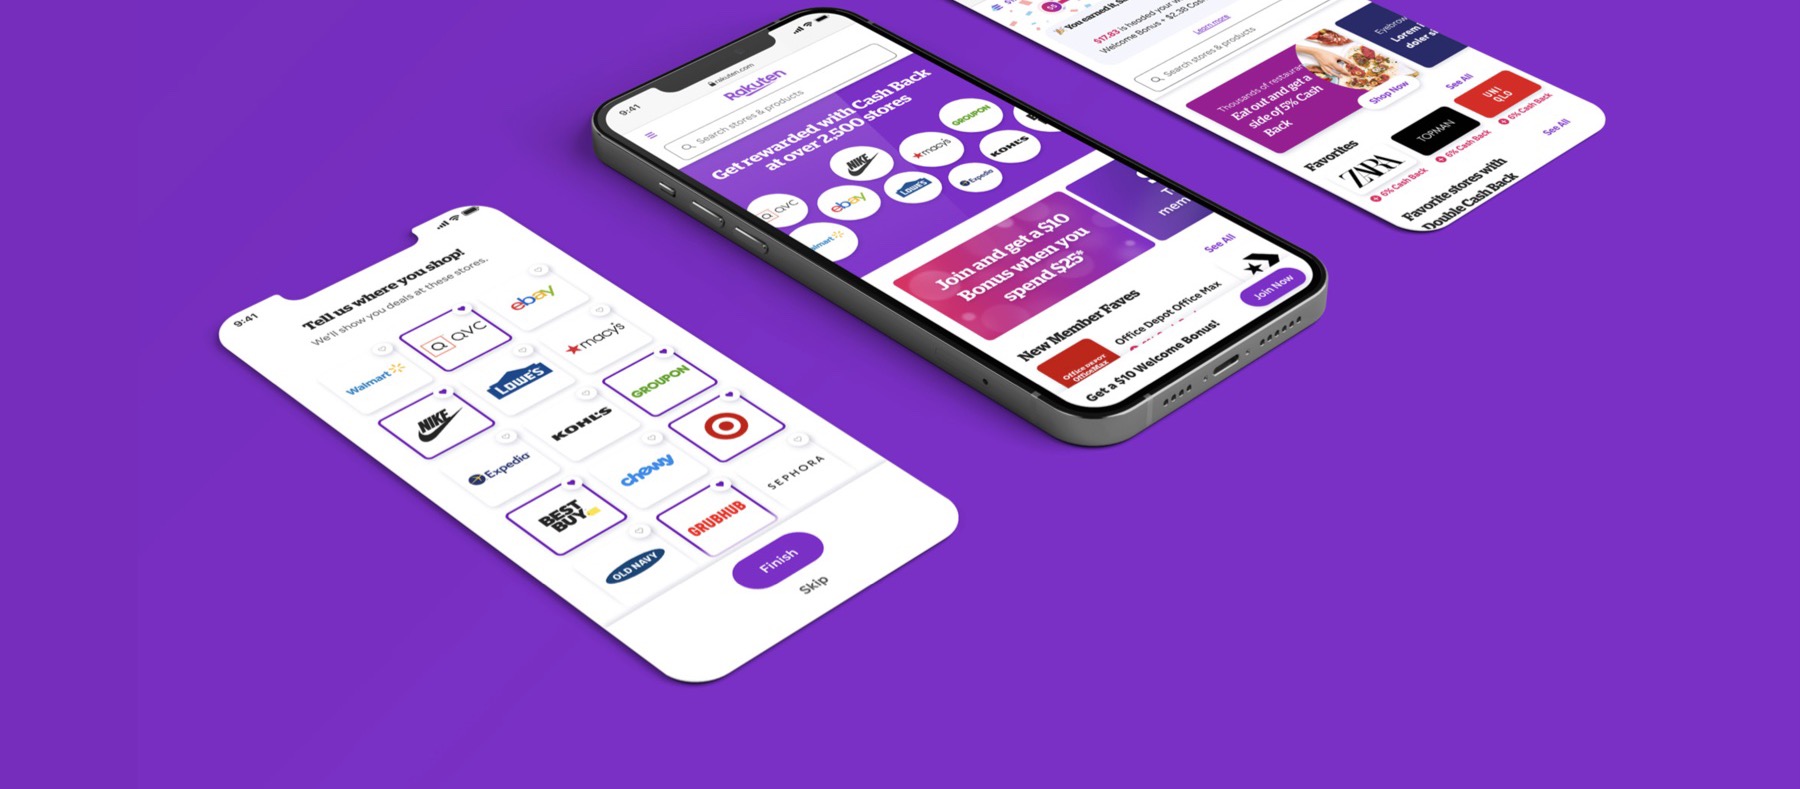
Visitor test drive. Anonymous visitors browse the home feed before signing up. The feed adds customized header banners and social proof. It adds a curated section of popular stores and a sticky footer that states the sign-up bonus.
Relevance · +4 points
Store favorites. New members pick two or more favorite stores after signing up. That narrowed the choices and made the feed personal. It was the largest lift.
Result
$2.5M in 12 weeks. A funded rebuild.
What changed
The tests showed that targeted interventions stop the leak at the top of the funnel. Leadership funded the next phase: a full, end-to-end onboarding rebuild.
Rakuten had measured teams on output. Discovery was discouraged, and gut decisions drove roadmaps. We introduced rapid validation, shared learning, and alignment on outcomes. Testing stopped being the risk. Not testing became the risk.
Challenges
- No good analytics, and thousands of sham accounts.
- The company rewarded output over outcome.
- Discovery was discouraged, and gut decisions were encouraged.
- A condensed timeline.